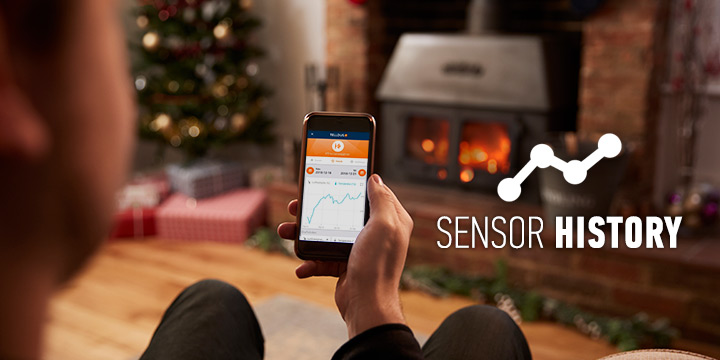
New app version! v3.8
It's beginning to look alot like Xmas... and time for a new version of our app!
Version 3.8 is now rolled out to all users, this version includes a highly requested feature: sensor history charts!
It also includes sensor details and device types.
For sensor history charts, it's possible to choose the span to show, show up to two scales at the same time and it's also possible to choose whether to interpolate the chart or not.
To access the history, simply swipe the sensor row to the left, tap the settings icon and tap the ‘History’ tab.
The sensor details shows the battery level (if supported by the sensor) and makes it possible to change the name of a sensor, select if it should be on the dashboard, if the sensor should be hidden or not, if sensor history should be stored or not and it’s also possible to delete sensor history.
For better understanding the device icons are updated, and should now be able to distinguish various device types.
It’s possible to zoom the chart, the zoom might not work like you are used to. The trick is to do the zoom gesture and keep your fingers on the screen until the desired zoom level.
At the moment it's not possible to zoom when the chart is in fullscreen, this is because of some limitations in the underlying tech.
Under the hood
For implementing the charts we’ve chosen to use VictoryChart, a popular library among the React Native community, as it provides good d3 implementation with a lot of flexibility. It is an actively maintained work so we expect the limitations in touch/zoom to be resolved in an upcoming release.

 rss
rss
